|
Danni alle
persone
AREE COLPITE DA FRANE E DA INONDAZIONI CON
CONSEGUENZE PER LA POPOLAZIONE
SITES AFFECTED BY LANDSLIDES AND FLOODS WITH HUMAN CONSEQUENCES
IN ITALY
|
In Italia, ogni
anno frane ed inondazioni causano danni alla popolazione. Allo
scopo di valutare il grado di rischio per la popolazione, abbiamo
compilato un catalogo delle frane e delle inondazioni che hanno
causato morti, dispersi, feriti, sfollati e senzatetto. Il catalogo
è stato compilato analizzando diverse fonti d'informazione
fra cui l'archivio del Progetto AVI del CNR GNDCI, cataloghi
ed archivi storici su frane e inondazioni, rapporti su eventi
meteorologici, idrologici e sismici che hanno prodotto movimenti
franosi ed inondazioni, e descrizioni di singole frane od eventi
d'inondazione.
Nel periodo compreso fra il 1279 ed il 2002, il catalogo riporta
4521 eventi calamitosi, di cui 2366 relativi a frane (52,33%),
2070 ad inondazioni (45,79%), ed 85 a valanghe (1,88%). L'analisi
del catalogo indica come vi siano stati oltre 35.623 fra morti,
dispersi e feriti, in un totale di 2579 eventi di frana o d'inondazione.
Le vittime di movimenti franosi sono state almeno 12.382, in
1480 eventi. I morti per frana sono stati almeno 10.032, i dispersi
85 ed i feriti 2265. Gli eventi di frana fatali (quelli che
hanno causato morti o dispersi) sono stati 1013, con una frequenza
di 1,73 eventi fatali per anno. Le vittime d'inondazioni sono
state almeno 23.241, in 1018 eventi. I morti per inondazione
sono stati oltre 20.754, i dispersi 121, ed i feriti almeno
2366. Gli eventi di piena con conseguenze fatali sono stati
855, con una frequenza di 1,81 eventi fatali per anno. Nel periodo
considerato, il numero totale degli sfollati e dei senzatetto
supera le 733.000 persone, in 2197 eventi, di cui 167.084 a
causa di movimenti franosi e 569.200 a causa di inondazioni.
Le frane che hanno prodotto danni alla popolazione si sono verificate
in 1328 comuni (16.4%), e gli eventi di piena con danni alla
popolazione hanno colpito 1156 comuni (14.3%).
Il grado di completezza del catalogo storico delle frane e delle
inondazioni con conseguenze per la popolazione varia nel tempo,
ed in funzione dell'intensità dell'evento. Stimiamo che
il catalogo sia ragionevolmente completo solo a partire dal
1900. Nel periodo compreso fra il 1900 ed il 2002 (103 anni)
il catalogo riporta 4016 eventi, di cui 2114 (52,64%) relativi
a frane e 1902 (47,36%) relativi ad inondazioni. In questo periodo
vi sono stati oltre 12.614 fra morti, dispersi e feriti, in
un totale di 1995 eventi di frana o d'inondazione. Le vittime
di movimenti franosi sono state almeno 7525, in 1102 eventi.
I morti per frana sono stati almeno 5199, i dispersi 85 ed i
feriti 2241. Gli eventi di frana con conseguenze fatali sono
stati 895, con una frequenza di 8,68 eventi fatali per anno.
Le vittime di inondazioni sono state almeno 5089, in 878 eventi.
I morti per inondazione sono stati 2634, i dispersi 115 ed i
feriti almeno 2340. Gli eventi di piena con conseguenze fatali
sono stati 773, con una frequenza di 7,50 eventi fatali per
anno. Nel periodo 1900-2002, il numero degli sfollati e dei
senzatetto supera le 700.200 persone, di cui almeno 537.900
a causa di inondazioni ed almeno 162.300 a causa di frane.
Da gennaio a settembre del 2003 si sono verificati 5 eventi
di frana con 2 vittime e 7 eventi d'inondazione che hanno causato
un totale di 6 vittime ed un ferito. Gli sfollati ed i senzatetto
sono stati oltre 600.
|
In Italy, landslides
and floods cause damage to people every year. To ascertain the
risk to the population, we have compiled a catalogue of floods
and landslides that occurred in Italy between 1279 and 2002
that resulted in deaths, missing persons, injuries, evacuees
and homeless. The catalogue was assembled from a variety of
sources, including the AVI Project database compiled by CNR
GNDCI, existing catalogues and archives on landslides and floods,
reports of meteorological, hydrological and seismic events that
triggered slope failures and produced inundations, and accounts
or descriptions of individual landslide and flood events.
For the period from 1279 to 2002, the catalogue lists 4,521
harmful events, of which 2,366 were related to landslides (52.33%),
2,070 to floods (45.79%), and 85 to snow avalanches (1.88%).
Analysis of the catalogue indicates that more than 35,623 people
died, were reported missing or were injured in a total of 2,579
landslide and flood events. Landslide casualties reached a total
of 12,382 (including 10,032 deaths, 85 missing persons and 2,265
injured) in 1,480 landslide events. Fatal landslide events total
1,013, equivalent to a frequency of 1.73 fatal events every
year. Casualties caused by inundations total 23,241 (including
20,754 deaths, 121 missing persons and 2,240 injured) in 1,256
flood events. Fatal flooding events total 855, equivalent to
a frequency of 1.81 fatal events every year. In the investigated
period, the total number of homeless and evacuees exceeds 733,000,
of which 167,084 were the result of mass movements and 569,200
were the result of inundations. Landslide events with human
consequences were inventoried in 1,328 (16.4%) of the 8,103
Italian municipalities. Harmful floods were reported in 1,156
(14.3%) municipalities.
The completeness of historical catalogue of landslides and floods
with human consequences varies with time and the intensity of
the harmful events. We estimate that the catalogue is reasonably
complete only after 1900. In the period from 1900 to 2002 (103
years) the catalogue reports 4,016 landslide or flood events,
of which 2,144 (52.64%) were related to slope movements and
1902 (47.36%) to inundations. In this period, landslide and
flood casualties numbered 12,614, in a total of 1,995 events.
Landslide casualties totalled 7,525 (including 5,199 deaths,
85 missing persons and 2,241 injured) in 1,018 landslide events.
Fatal landslide events numbered 895, equivalent to a frequency
of 8.68 fatal events every year. Flood casualties totalled 5,089
(including 2,634 deaths, 115 missing persons and 2,340 injured)
in 878 flooding events. Fatal landslide events numbered 773,
equivalent to a frequency of 7.50 fatal events every year. In
the period from 1900 to 2002, the total number of homeless and
evacuees exceeds 700,200 people, of which 162,300 were the result
of mass movements and 537,900 as a result of inundations.
During the period of January to September 2003 there were 5
fatal landslide events with 2 deaths, and 7 harmful flood events
with 6 fatalities and one injured person. Homeless and evacuees
exceeded 600.
|
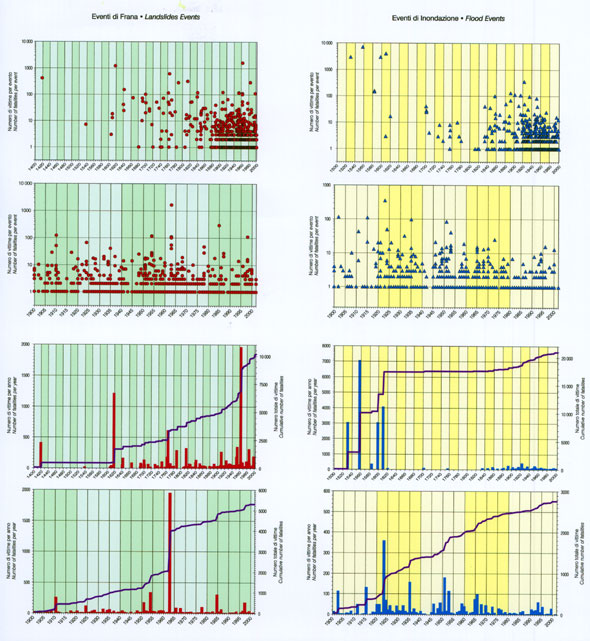
DISTRIBUZIONE STORICA DEGLI EVENTI CON VITTIME
I grafici riportano la distribuzione delle
vittime (morti e dispersi) per frana e per inondazione in
Italia. I punti (per le frane) ed i triangoli (per le piene)
indicano il numero di vittime in ciascun evento. Gli istogrammi
riportano il numero di vittime per anno. Le curve rappresentano
il numero cumulato di vittime. Nei grafici sono indicate
le date di alcuni degli eventi più catastrofici.
Per le frane sono riportati gli eventi con vittime nel periodo
1400 - 2002. Per le inondazioni sono riportati gli eventi
con vittime nel periodo 1500 - 2002.
Nel periodo compreso fra il 1400 ed il 2002, l'anno più
catastrofico per le frane è stato il 1963, con 1950
vittime di cui 1917 al Vajont (Veneto e Friuli-Venezia Giulia).
Il secondo anno più catastrofico è stato il
1618, con 1200 vittime prodotte dalla frana di Piuro (Lombardia),
ed il terzo anno più catastrofico è stato
il 1765, anno in cui la frana di Roccamontepiano (Abruzzo)
causò la morte di 600 persone. Nel periodo compreso
fra il 1500 ed il 2002, l'anno più catastrofico per
le inondazioni è stato il 1557, con 7000 vittime
a Palermo (Sicilia). Il secondo anno più catastrofico
è stato il 1610, con 4034 vittime la maggior parte
delle quali in Piemonte, seguito nell'ordine dal 1530 e
dal 1598, entrambi con 3000 vittime stimate a Roma. A partire
dal 1900 e fino al 2002, gli anni nei quali si sono avute
oltre 100 vittime per frana sono stati: 1910 (255 morti),
1924 (118 morti), 1951 (167 morti e dispersi), 1954 (336
morti), 1963 (1950 morti e dispersi), 1985 (300 morti e
dispersi) e 1998 (171 morti e dispersi). Nello stesso periodo,
gli anni nei quali si sono avute oltre 100 vittime per inondazione
sono stati: 1902 (113 morti), 1915 (131 morti), 1923 (359
morti), 1935 (157 morti), 1951 (178 morti e dispersi), 1953
(114 morti) e 1985 (271 morti e dispersi).
|
HISTORICAL DISTRIBUTION OF FATAL EVENTS
The graphs portray the historical pattern of fatalities (deaths
and missing persons) in Italy caused by floods and landslides.
Dots (for landslides) and triangles (for floods) indicate
schematically the number of fatalities in each event. The
histograms show the number of fatalities per year. The curves
show the cumulative number of fatalities. The dates of some
of the most destructive events are shown. For landslides we
show fatal events during the period from 1400 to 2002. For
floods we show fatal events during the period from 1500 to
2002.
Between 1400 and 2002, the worst year for landslides was 1963
with 1950 casualties, 1,921 of which occurred at Vajont (Veneto
and Friuli-Venezia Giulia). The second worst year was 1618,
when 1,200 people were killed by the Piuro rockslide-avalanche
(Lombardy), followed by 1765 with about 600 deaths at Roccamontepiano
(Abruzzo). Between 1500 and 2002, the worst year for floods
was 1557, with as many as 7,000 estimated flood casualties
in Palermo (Sicily). The second worst year was 1610, with
4,034 deaths, most of which were caused by floods in Piedmont,
followed by 1530 and 1598, both with 3,000 estimated flood
casualties in Rome (Lazio). In the period between 1900 and
2002, the years in which more than one hundred people were
killed by landslides were: 1910 (255 deaths), 1924 (118 deaths),
1951 (167 deaths and missing persons), 1954 (336 deaths),
1963 (1,950 deaths and missing persons), 1985 (300 deaths
and missing persons) and 1998 (171 deaths and missing persons).
In the same period, the years in which more than one hundred
people were killed or were missing by floods were: 1902 (113
deaths), 1915 (131 deaths), 1923 (359 deaths), 1935 (157 deaths),
1951 (178 deaths and missing persons), 1953 (114 deaths) and
1985 (271 deaths and missing persons).
|
 |
|
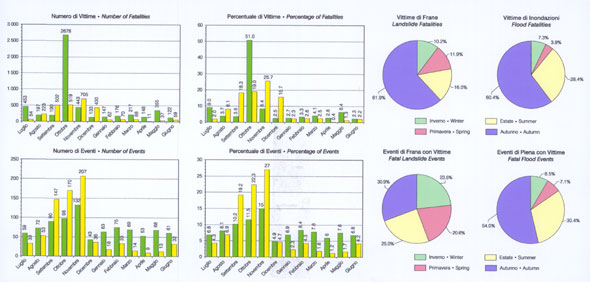
DISTRIBUZIONE STAGIONALE DEGLI EVENTI CON
VITTIME
Nel periodo compreso fra il 1900 ed il 2002 (103 anni) il
catalogo riporta 765 eventi d'inondazione (99,0%) e 883 eventi
di frana (98,7%) con vittime (morti e dispersi) per i quali
è noto il mese d'occorrenza. Per le inondazioni, il
maggior numero di vittime (705, 25,7%) ed il maggior numero
di eventi con conseguenze fatali (207, 27,0%) si sono verificati
in Novembre. Per le frane, le vittime (2678, 51,0%) sono state
più numerose in Ottobre, e gli eventi con conseguenze
fatali (132, 15,0%) sono stati più numerosi in Novembre.
La stagione più pericolosa è l'autunno, con
il 61,9% delle vittime per frana ed il 60,4% delle vittime
per inondazione, e con il 30,9% degli eventi di frana ed il
54,0% degli eventi d'inondazione con conseguenze fatali.
|
SEASONAL DISTRIBUTION OF FATAL EVENTS
In the period from 1900 to 2002 (103 years) the catalogue
lists 765 fatal floods (99.0%) and 883 fatal landslide (98.7%)
events for which the month of the occurrence is known. For
floods, the largest number of fatalities (705 or 25.7%) and
the largest number of fatal events (207 or 27.0%) occurred
in November. For landslides, fatalities were most numerous
in October (2,678 or 51.0%), and fatal events (132 or 15.0%)
were most abundant in November. Autumn is the most destructive
season, with 61.9% of the landslide fatalities and 60.4% of
the flood fatalities, and with 30.9% of the fatal landslide
events and 54.0% of the fatal flood events.
|
|
|
|
RISCHIO DA FRANA E DA INONDAZIONE PER LA
POPOLAZIONE
L'analisi del rischio cerca di determinare il tipo, la probabilità
e l'intensità del danno causato da eventi naturali
calamitosi, quali le inondazioni e le frane, ed a stabilire
soglie accettabili per i livelli di rischio individuale e
collettivo. Il rischio individuale è quello a cui è
soggetto un individuo ed è espresso dall'indice di
mortalità, ossia dal numero di vittime ogni 100.000
persone in un periodo di tempo predefinito. Il rischio collettivo
(o sociale) è quello posto da un pericolo alla società
nella sua interezza, ed è definito sulla base dello
studio delle relazioni fra la frequenza degli eventi calamitosi
e la loro intensità, misurata dal numero di vittime.
|
LANDSLIDE AND FLOOD RISK TO THE POPULATION
OF ITALY
Risk analysis aims at determining the type, probability and
intensity of damage caused by natural events, such as a flood
or a landslide, and to establish thresholds for the acceptability
of individual and societal risk. Individual risk is the risk
posed by a hazard to any identified individual, and it is
expressed using mortality rates, which are given by the number
of deaths per 100,000 of any given population over a pre-defined
period. Societal risk is the risk imposed by a hazard on society,
and it is established by investigating the relationship between
the frequency of the damaging events and their intensity,
as measured by the number of fatalities.
|
|
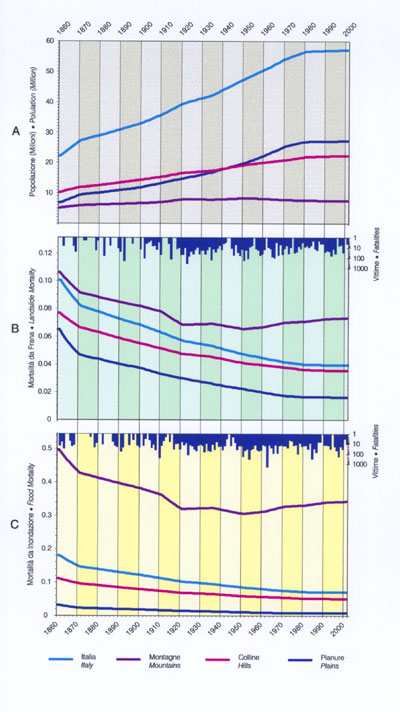
RISCHIO INDIVIDUALE
Combinando le informazioni sulla popolazione con il totale
di vittime per anno abbiamo calcolato gli indici di mortalità
per frana e per inondazione. Nel periodo compreso fra il 1860
ed il 2002 l'indice di mortalità medio da frana è
0,084, e l'indice di mortalità medio da inondazione
è 0,056. La mortalità da frana è stata
massima nel 1963 (3,802), l'anno del disastro del Vajont,
mentre la mortalità da inondazione è stata massima
nel 1923 (0,903), l'anno del crollo della diga di Gleno. La
mortalità dipende dalla popolazione a cui è
riferita. In Italia la popolazione è cresciuta da 22,16
milioni nel 1861 a 56,99 milioni nel 2001 (A). La mortalità
è quindi diminuita da 0,18 a 0,07 per le frane e da
0,10 a 0,04 per le inondazioni. La popolazione in Italia non
è però aumentata in modo omogeneo (A). I grafici
mostrano la variazione nel tempo della mortalità da
frana (B) e da inondazione (C) in diverse aree fisiografiche.
La mortalità da frana e da inondazione per l'intero
territorio nazionale è diminuita sensibilmente dal
1860 al 1920, è diminuita dal 1920 al 1980, ed è
rimasta invariata dopo il 1980. Nelle aree montane la mortalità
è diminuita dal 1860 al 1920, è rimasta costante
fino al 1950, ed è aumentata, per le frane in modo
rilevante, dopo il 1950.
|
INDIVIDUAL RISK
By combining information on the population with the annual
number of flood and landslide fatalities, we estimated death
rates for floods and landslides. In the period between 1860
and 2002, the average landslide mortality rate was 0.084,
and the flood mortality rate averaged 0.056. Landslide mortality
was highest in 1963 (3.802), the year of the Vajont landslide
disaster, and flood mortality was largest in 1923 (0.903),
the year of the Gleno dam failure disaster. Mortality depends
on the size of the population, which in Italy has grown
from 22.16 million in 1861 to 56.99 million in 2001. The
average mortality has therefore decreased, from 0.18 to
0.07 for landslides and from 0.10 to 0.04 for floods. However,
population has not increased uniformly across Italy (A).
Graphs B and C show the temporal variation of the mortality
for landslides and floods in different physiographical regions.
Mortality for the entire country decreased significantly
in the period 1860 to 1920, decreased less distinctly in
the period 1920-1980, and remained constant in the period
1980-2002. In mountain areas, death rates decreased significantly
in the period 1860-1920, remained about constant in the
period 1920-1950, and increased, particularly for landslides,
in the period 1950-2002.
|
|
|
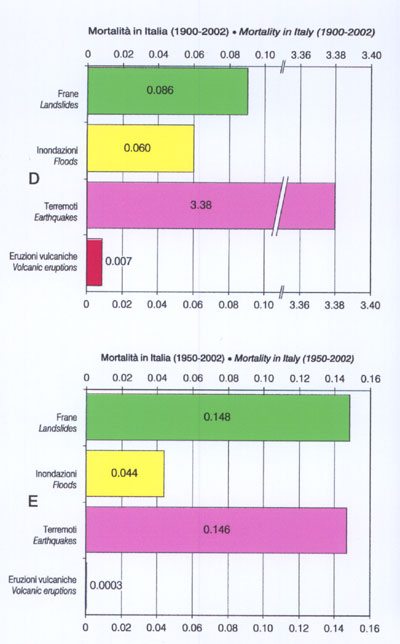
| In Italia, frane
ed inondazioni non sono gli unici fenomeni naturali a mettere
a rischio la vita delle persone. Tra il 1900 ed il 2002, 38
terremoti hanno causato circa 125.000 vittime, di cui oltre
85.000 nel terremoto di Messina e Reggio Calabria del 1908,
ed oltre 32.500 nel terremoto di Avezzano del 1915. Nello stesso
periodo, 18 eruzioni vulcaniche hanno causato 276 vittime e
196 feriti. Le figure D ed E mettono a confronto la mortalità
da frana, inondazione, terremoto ed eruzione vulcanica dal 1900
al 2002 e dal 1950 al 2002. Per l'Italia, sono anche disponibili
stime della mortalità per alcuni rischi tecnologici e
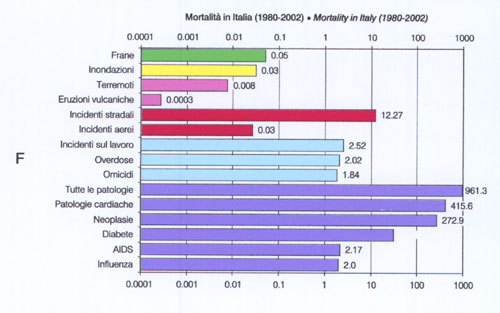
sociali, e per le principali patologie mediche. La figura F
mette a confronto, per il periodo 1980-2002, la mortalità
da frana, inondazione, terremoto ed eruzione vulcanica, con
la mortalità connessa ai rischi tecnologici (incidenti
d'auto ed aerei) e sociali (omicidi, incidenti sul lavoro) ed
alle principali patologie mediche. La mortalità da frana
e da inondazione è molto inferiore alla mortalità
per le principali patologie mediche, inferiore alla mortalità
per cause sociali, ed inferiore o simile alla mortalità
per alcuni rischi tecnologici. |
In Italy, landslides
and floods are not the only natural hazards that pose a threat
to human life. In the period from 1900 to 2002, 38 earthquakes
have resulted in about 125,000 fatalities, of which more than
85,000 were caused by the Messina-Reggio Calabria (Sicily and
Calabria) earthquake of 1908, and about 32,500 were caused by
the Avezzano (Abruzzo) earthquake of 1915. During the same period,
18 volcanic eruptions have caused 472 casualties, including
196 injured people. Figures D and E compare the mortality for
landslides, floods, earthquakes, and volcanic eruptions for
the period 1900-2002 and for the period 1950-2002. In Italy,
mortality rates are available for a variety of medical, technological
(car and airplane accidents) and human-induced (homicides, workplace
accidents) risks. For the period between 1980 and 2002, Figure
F compares the mortality for landslides, floods, earthquakes,
and volcanic eruptions with the death rates for medical, technological
and human-induced risks. Inspection of figure F reveals that
mortality for natural hazards is much lower than the leading
medical causes of death, and lower than or comparable to the
rates of many voluntary risks. |
|
|
|
|
|
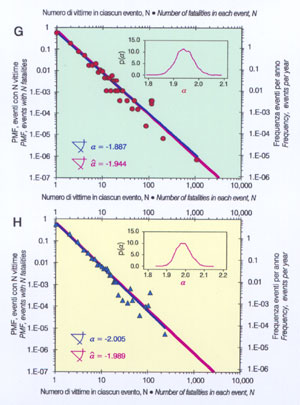
RISCHIO SOCIALE
Per definire il rischio sociale analizziamo la relazione
fra gli eventi fatali di frana e di inondazione e la loro
intensità, definita dal numero di vittime (morti e
dispersi). Le figure G ed H riportano la probabilità
(PMF) e la frequenza degli eventi fatali per anno, sia per
le frane (pallini verdi) che per le inondazioni (triangoli
blu). Le distribuzioni di frequenza sono state ottenute utilizzando
una tecnica di campionamento ad intervalli variabili, e rappresentano
una stima della distribuzione di probabilità degli
eventi fatali rispetto alle loro conseguenze. Nei diagrammi
bi-logaritmici le distribuzioni mostrano un andamento lineare
che indica che esse possano essere rappresentate da leggi
di potenza. Tale andamento rivela un comportamento "auto-similare",
importante perché permette di utilizzare gli eventi
più frequenti e meno intensi per stimare la probabilità
d'occorrenza degli eventi meno frequenti ma più intensi.
I parametri delle leggi di potenza sono stati stimati attraverso
il metodo dei minimi quadrati. I risultati sono illustrati
dalle linee blu nelle figure G ed H. Gli esponenti delle leggi
di potenza sono risultati essere circa -2,00 per le piene
e -1,89 per le inondazioni. Un limite di tale approccio riguarda
la tecnica di campionamento che in alcuni casi è soggettiva.
Per superare questo problema i parametri del modello possono
essere stimati direttamente dal catalogo degli eventi, senza
dover utilizzare la distribuzione di frequenza. Per fare questo,
formuliamo il modello in termini probabilistici e ne stimiamo
i parametri utilizzando una metodologia bayesiana. Per descrivere
dati distribuiti secondo una legge di potenza abbiamo a disposizione
due distribuzioni: la distribuzione di Pareto e la distribuzione
Zeta. Entrambe le distribuzioni permettono di definire la
probabilità di eventi casuali, al di sopra di una soglia
minima predefinita. La distribuzione di Pareto si applica
a valori che possono essere frazionari, mentre la distribuzione
Zeta si applica a valori che sono solo interi. Data la natura
della nostra variabile casuale (vittime), per analizzare il
catalogo degli eventi storici che hanno prodotto vittime abbiamo
adottato la distribuzione Zeta. Le linee rosse nelle figure
G ed H indicano le leggi di potenza così ottenute con
il metodo bayesiano. Nell'angolo in alto a destra delle figure
sono riportate le distribuzioni di probabilità dell'esponente
a con valor medio di -1,99 per le inondazioni e -1,94 per
le frane.
|
SOCIETAL RISK
To determine societal risk, we investigate the relationship
between the probability of harmful landslide and flood events
and the magnitude of the events as measured by the number
of fatalities (deaths and missing persons). The scatter plots
in figures G and H portray the Probability Mass Function (PMF)
and the frequency of fatal events per year, both for landslides
(G, green dots) and floods (H, blue triangles). The distributions
were obtained by applying a variable-width binning technique,
and represent an estimate of the probability distribution
of fatal events vs. their consequences. The distributions
exhibit a clear linear trend in the log-log plots, which indicates
that they are approximately power-law distributed. The linear
trend suggests a self-similar scaling behaviour of the losses,
which is important because it allows the use of more frequent,
small intensity events to estimate the rate of occurrence
of the less frequent, larger events.
To estimate the parameters of the power-law model we perform
a linear regression (least squares method). Results are shown
by the blue lines in figures G and H. The exponents of the
power-law regression fits are about -2.00 for floods and -1.89
for landslides. A weakness of the regression method is the
need to "bin" the data in order to obtain an estimate
of the probability distribution, an ad hoc procedure that
makes the process of model inference indirect. We can infer
the power-law model directly from the raw data (i.e., without
having to estimate a probability distribution). We accomplish
this by formulating the model in a full probability fashion,
and by inferring model parameters using a Bayesian methodology.
Two probability distributions are appropriate to model power-law
distributed data: the Pareto distribution and the Zeta distribution.
Both distributions prescribe a power-law probability for the
size of a random event, above a cut-off value. The Pareto
distribution applies to numbers that can be fractional, whereas
the Zeta distribution applies to integer values only. Since
fatalities occur in integer numbers, we assume a Zeta distribution
to model the catalogue of historical landslide and flood fatalities.
The red lines in figures G and H show the inferred power-law
(Zeta) distributions. The insets show the probability distributions
of the scaling exponents around mean values of about -1.99
for floods and -1.94 for landslides.
|
|
|
|

|

 list.irpi.cnr.it